April 2022. Atlassian accidentally took 775 customer companies offline. Their Jira, their Confluence, their projects, their data — inaccessible. For 13 days.
The monthly uptime figure on record: 73%. The contractual SLA: 99.9%. Maximum compensation under the contract: 50% of one monthly bill. For a company paying $10,000/month, that meant $5,000 in credit. For those same companies, the real cost of two weeks of paralysis — blocked projects, idle teams, shattered trust — ran into the tens or hundreds of thousands of dollars.
This is not a story about incompetence. It is a demonstration that the number displayed and the reality experienced can diverge completely. And that the way uptime is calculated determines what it actually represents.
One Number, Very Different Realities
99.9%. That is what most tools display. That is what most SaaS products promise in their contracts. It is also a number that can mean very different things depending on the calculation method used.
Translated into real time, the picture is striking:
| SLA | Annual downtime | Monthly downtime |
|---|---|---|
| 99% | 3 days 15h | 7h 18min |
| 99.9% | 8h 45min | 43min 50s |
| 99.99% | 52min 35s | 4min 23s |
| 99.999% | 5min 15s | 26s |
The gap between "three nines" and "four nines" is not marginal: it is the difference between a potential 8 hours of interruption per year and less than one hour. For a productivity tool, a critical API, a payment service, that gap represents something concrete — for your teams, and for your own customers.
But these numbers are only meaningful if the calculation that produces them is honest. And that is where things get complicated.
How Perimon Calculates Your Uptime
Perimon does not count failed checks. It measures interruption periods — from the moment an incident is declared to the moment it resolves. The difference is not academic: it determines whether the number displayed represents something real.
From Check to Event: The Pipeline
When the detection threshold is crossed, Perimon emits a timestamped event:
The FIRED event marks the start of the interruption with a precise timestamp. The RESOLVED event marks its end. Together, they form an incident period measurable to the second.
Detection with Hysteresis
To prevent a transient error — a brief network timeout, a momentary load spike — from triggering a false alert, Perimon analyses the last 3 consecutive checks before declaring an incident:
- Entering incident: ≥ 2 errors in the last 3 checks
- Exiting incident: ≤ 1 error in the last 3 checks
This asymmetric threshold — stricter to enter than to exit — is called hysteresis. It absorbs ephemeral errors without masking real outages, and prevents flapping: an unstable service oscillating between error and success does not generate a flood of contradictory alerts.
The trade-off of this 3-check window is detection latency: if checks run every 5 minutes, an incident can take up to 10 minutes to be officially declared. To compensate, Perimon uses a fast recheck: as soon as a check returns an error without the threshold being crossed, a new check is triggered after a brief delay — without waiting for the next scheduled interval. The same logic applies on the way out: if an incident is active and a check comes back positive, Perimon rechecks quickly to confirm the service has recovered before emitting the RESOLVED event. The fast recheck reduces MTTD on entry and MTTR on exit — without compromising the anti-flapping robustness.
The Formula
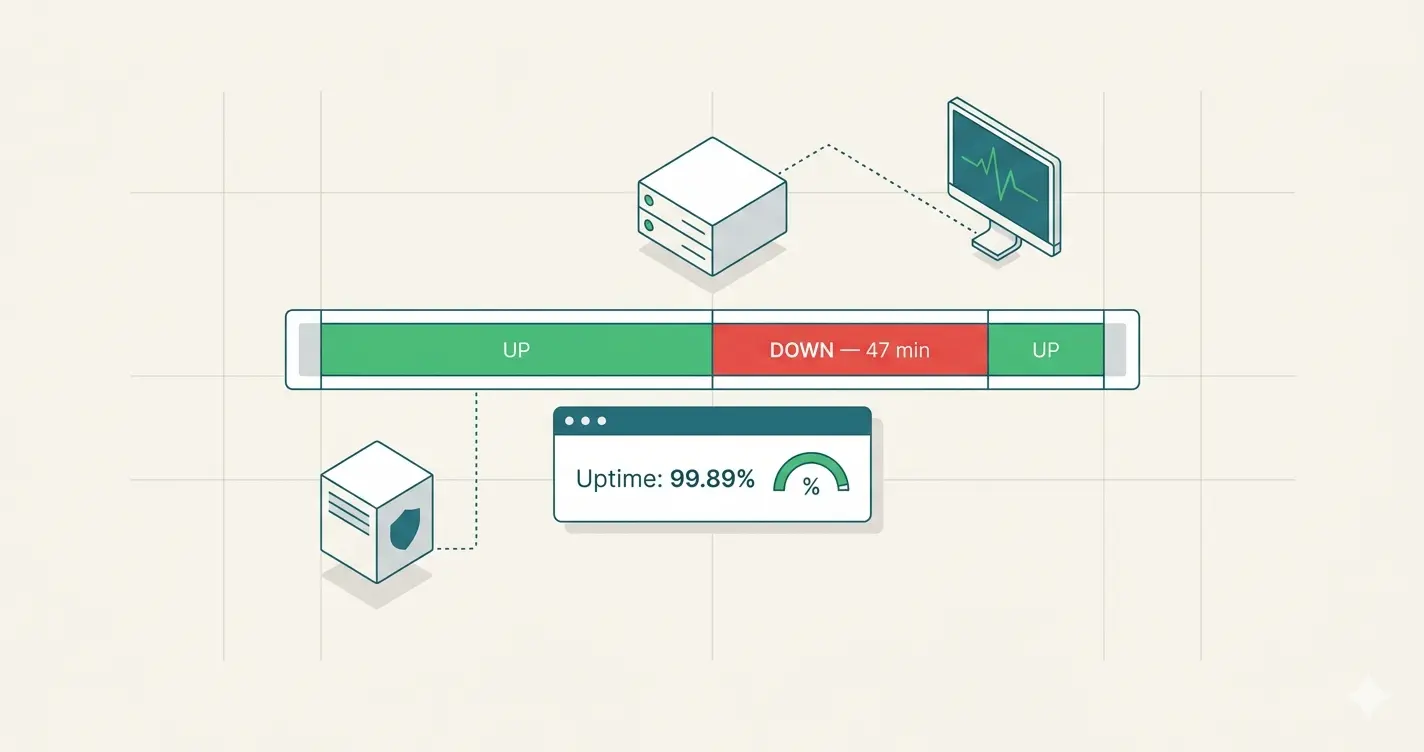
uptime % = (total_period − cumulative_downtime) / total_period × 100
Over 30 days: if incidents account for 47 minutes of cumulative downtime, uptime is (43,200 min − 47 min) / 43,200 min × 100 = 99.89%. Not an estimate from samples. A measurement from real periods.
The Double-Counting Problem
Measuring periods raises a concrete challenge: what happens when two incidents overlap?
A real-world example — two simultaneous incidents on the same window (HTTP 503 + expired SSL):
Adding the two incidents would count the 10:15–10:25 window twice. Perimon applies an interval merge algorithm: overlapping periods are merged before the calculation. The cumulative downtime always represents the real time your service was unavailable to your users — no redundancy.
The same mechanism handles edge cases naturally:
- An incident that started before the analysed period is clipped to
period_start - An incident still active at the end of the period is clipped to
period_end - A period with no incidents returns 100% — the absence of evidence of interruption is treated as full availability
What Your Uptime Number Cannot Tell You Alone
The Google SRE book makes a counterintuitive observation: "A user on a 99% reliable smartphone cannot tell the difference between 99.99% and 99.999% service reliability." Beyond a certain threshold, the marginal reliability gain costs exponentially more — and remains imperceptible to the end user.
This is not an argument for settling for the minimum. It is a reminder that the uptime figure, however accurate, cannot answer the two questions that actually matter when something goes wrong:
Did you know in time? Every minute of undetected incident means users abandoning, transactions failing, support tickets stacking up. The uptime number records the outage after the fact. An immediate alert is the difference between a 3-minute interruption and a 45-minute one.
Do your users know? When a service is degraded, users cannot tell whether the problem is their connection, their configuration, or you. They reload the page. They open a support ticket. They lose confidence. That uncertainty has a cost — in time, in frustration, in the customer relationship.
How Perimon Addresses Both
Perimon calculates uptime from real interruption periods. But calculating accurately is not enough.
On response time: as soon as an incident is declared, an alert fires immediately. The goal is not to discover the outage in the dashboard the next morning. It is to be notified the moment the threshold tips — so you can act before a few-minute interruption becomes an hour of downtime in your end-of-month logs.
On user trust: every incident detected by Perimon can be reflected in real time on a public status page. Your users see the state of your services, the timeline of ongoing and resolved incidents — without having to contact support to find out whether the problem is on their end or yours. During an outage, transparency does not undo the interruption — but it eliminates the doubt, reduces unnecessary support load, and preserves the relationship.
Accurate uptime measures what happened. Alerts reduce how long it lasts. The status page manages what your users experience while you respond. Three answers to three distinct problems — and all three matter.